Built for executives, owners & therapy leadership
You need the same truth your DORs and billing managers see — rolled up for the portfolio. Phoenix ties clinical throughput, revenue, and risk into executive and regional dashboards so you are not reconciling spreadsheets every Monday.
- ·Revenue & AR visibility across contracts and facilities: billing status, invoices, aging, and denials in context with documentation and authorizations.
- ·50+ standard reports spanning clinical, billing, and staff — plus scheduled delivery when you need a steady board rhythm.
- ·Custom report builder across 30+ data sources for metrics that are unique to your contracts and regions.
- ·AI dashboards from natural language: ask for utilization, PDPM/CMG-oriented views, or payer mix without waiting on a BI queue.
- ·Role-based executive views with regional roll-ups while facilities stay properly isolated — see home dashboards and analytics below.
Every role gets
their own command center
11 purpose-built dashboards — from therapist caseloads to executive financials — so every team member sees exactly what they need to act on.
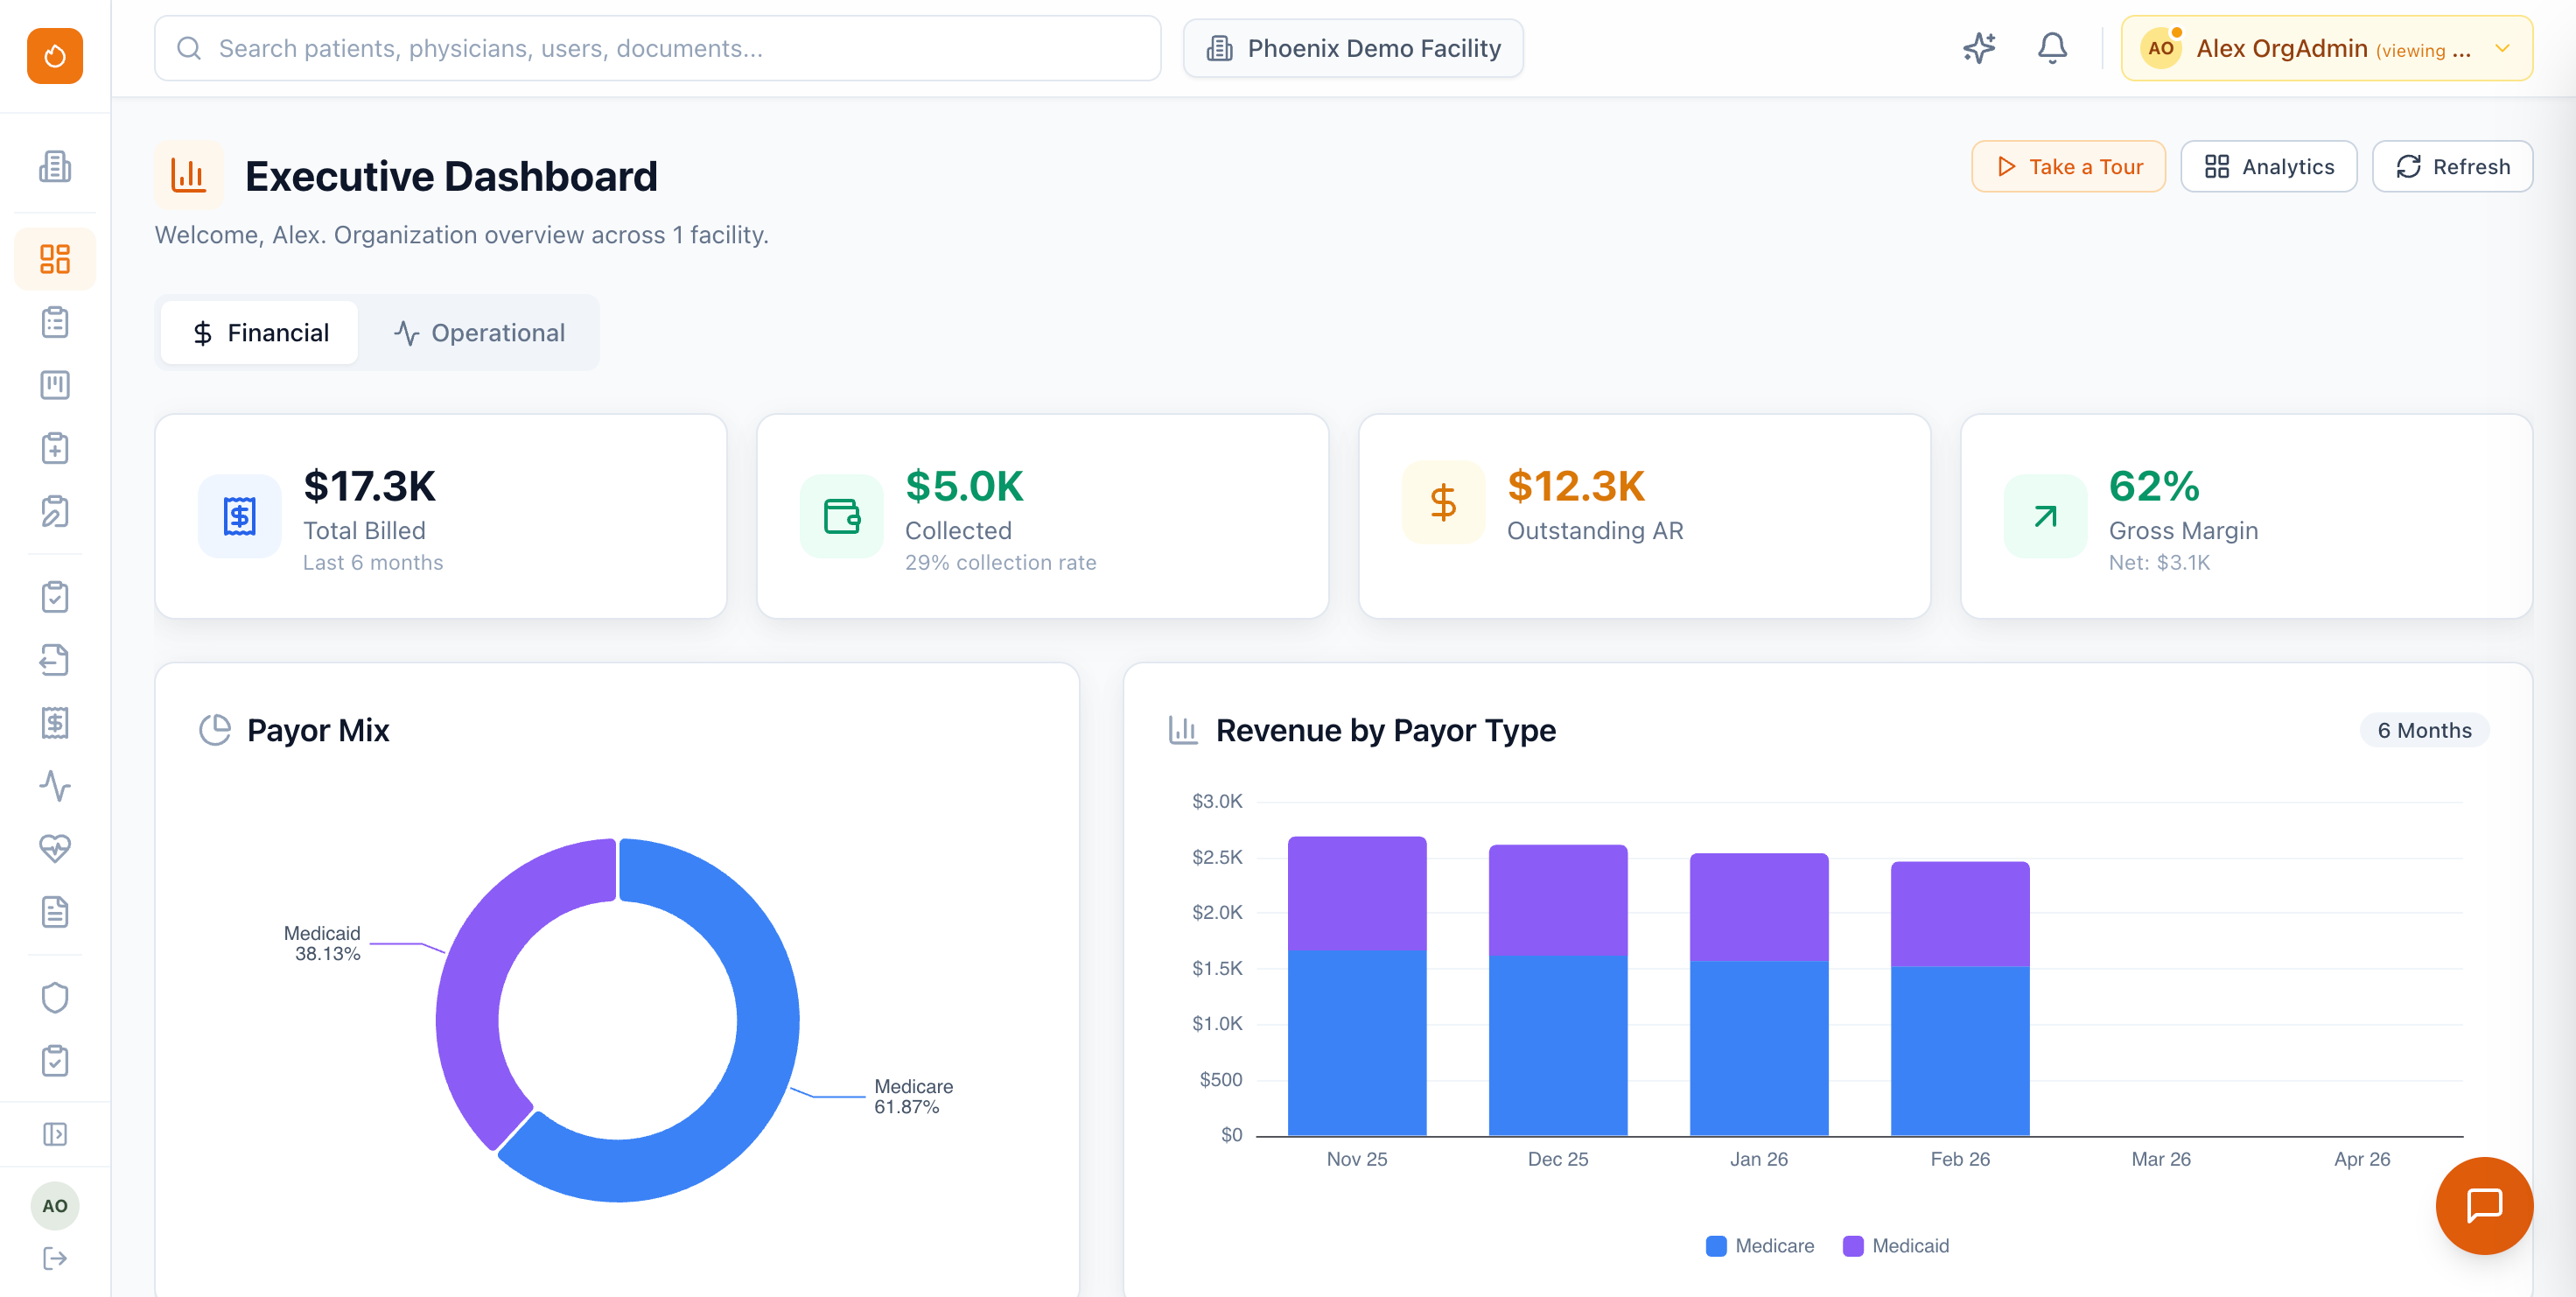
Executive Dashboard
Financial and operational tabs with billed/collected/outstanding revenue, collection rates, labor costs, gross margins, revenue by payor type, monthly trends, and predictive analytics — across the entire organization.
DOR Action Center
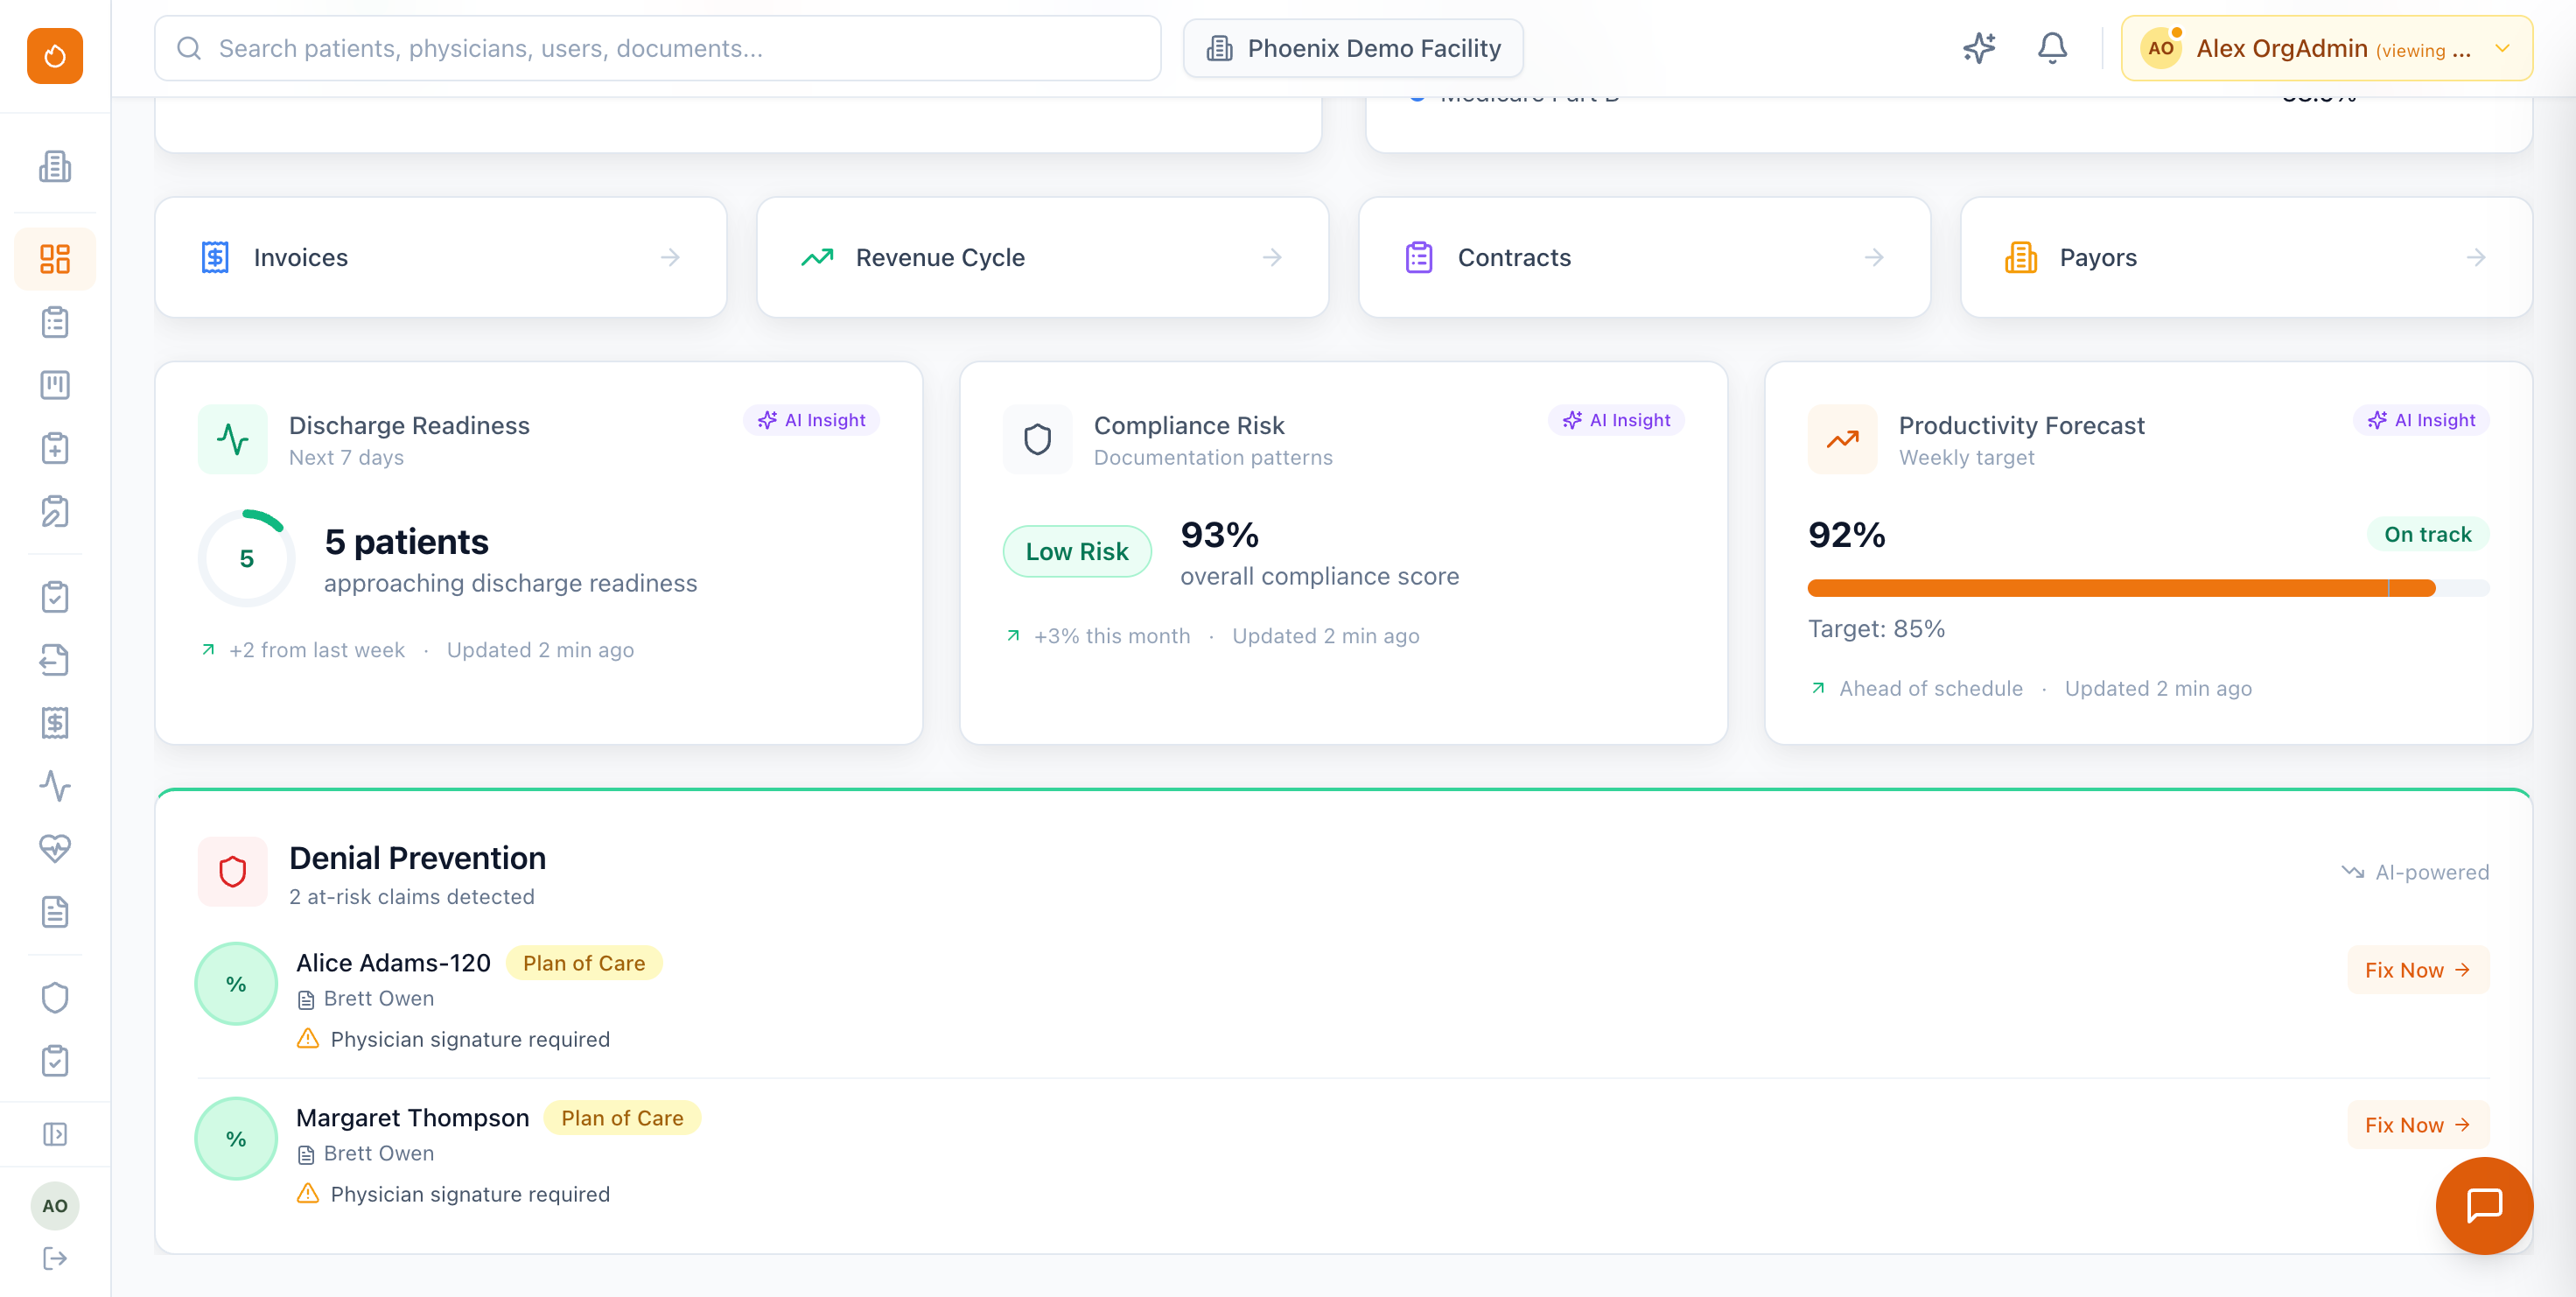
Director of Rehab command center with live census, productivity vs. target, and tabbed action items for planning, scheduling, authorizations, documentation, and screenings — plus smart scheduling suggestions and predictive cards.
Regional Director
Multi-facility view with per-facility census, staffing, productivity, visit volumes, and compliance alerts. Compare buildings side-by-side and drill into any facility with one click.
Therapy Director
Facility-level clinical operations — active patients, unassigned screenings, overdue documentation, staff productivity, AI compliance overview with pass rates and denial risk, and inline PTO approvals.
Therapist & Assistant
Daily schedule, documentation triggers, active caseload, co-treatment coordination, supervision tracking for assistants, screening assignments, and offline-ready treatment logging.
Billing Specialist
Total AR at a glance, close-out completion status, AR aging buckets, denial tracking, top payors by outstanding balance, and quick links to invoices, billing packets, and payment imports.
| Facility | Revenue | Margin | Prod. | Compliance |
|---|---|---|---|---|
| Sunrise Care | $187k | 34% | 91% | 97% |
| Oak Manor | $142k | 29% | 88% | 94% |
| Meadow Ridge | $98k | 18% | 76% | 82% |
| Valley View | $134k | 31% | 85% | 91% |
Compare every building, spot problems early
When you run therapy across multiple facilities, you need to know which buildings are hitting targets and which need attention — without waiting for someone to compile a spreadsheet. Phoenix rolls up clinical, financial, and operational data at every level of your organization.
Compare census, productivity, revenue, and compliance scores across buildings in a single view — filterable by region, customer, or setting.
Group facilities by geography, customer, or clinical setting. Regional directors and executives see aggregated KPIs that drill down to individual buildings.
Track billed, collected, and outstanding revenue per facility with collection rates, labor costs, and gross margin — so you can spot underperforming contracts early.
Organization-wide compliance dashboard shows audit pass rates, denial risk, unsigned documents, and supervision gaps across all facilities — ranked by risk level.
Set up automated weekly or monthly report packages delivered to your inbox — executive summaries, P&L by facility, and board-ready KPI decks without manual work.
Power BI–level analytics,
built right in
Forget exporting to spreadsheets or licensing a separate BI tool. Phoenix Therapy ships with a full-featured analytics engine — interactive dashboards, drill-downs, cross-facility comparisons, and AI that generates custom views from plain-language requests.
AI-Generated Dashboards
Tell AI what you want to see — "Show me revenue by payment model for Q1" or "Compare OT outcomes across my three facilities" — and get a polished, interactive dashboard without waiting on a BI team.
Enterprise-Grade Visualizations
Interactive charts, heat maps, pivot tables, trend lines, and drill-downs — the same visualization toolkit you'd expect from Power BI or Tableau, without the licensing cost or data pipeline.
50+ Standard Reports
Pre-built reports across three categories — Clinical (census, service logs, caseload, outcomes, supervision compliance), Billing (AR aging, denial tracking, P&L, CMG distribution, payor mix), and Staff (productivity, attendance, overtime, credential tracking, PTO usage).
Custom Report Builder
Build your own reports from 30+ data sources — patients, invoices, time entries, documents, contracts, and more. Choose tabular, summary, or matrix formats with user-defined columns, filters, and grouping. Organize in folders and share across your team.
See the portfolio story in one walkthrough
We’ll start from the metrics you care about — revenue, productivity, and risk — then show how they trace back to documentation and billing in Phoenix.
Request a demo